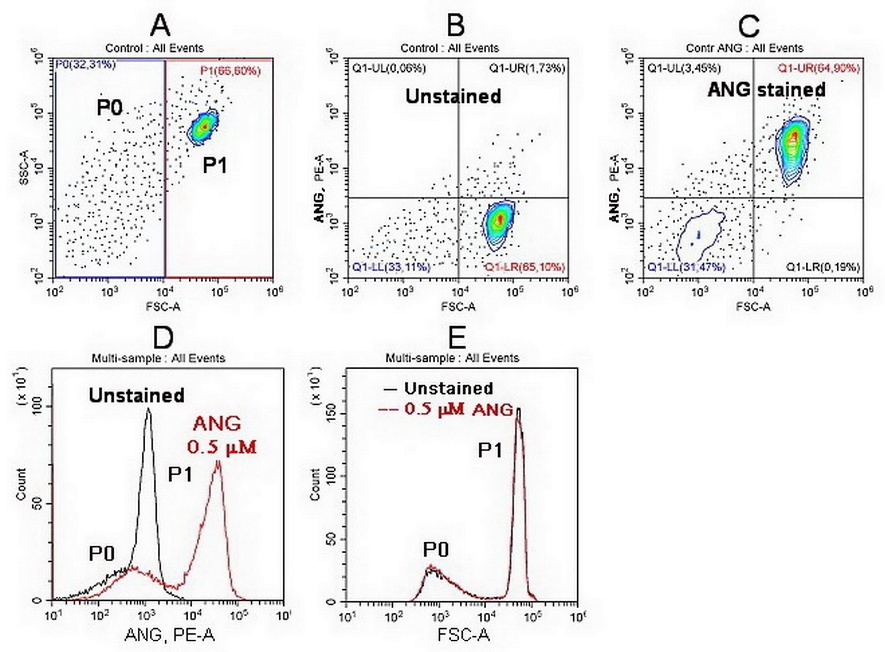
Fig. 1. ANG fluorescence (PE), SSC and FSC distributions of normal U937 cells in unstained (A, B) and ANG-stained (C) total cell cultures. Staining was achieved by exposing cells to 0.5 µM ANG-AM for 30 min, as described in the Methods section. (D) Histograms of the fluorescence for unstained and ANG-stained cells in ANG-specific PE channel. (E) FSC histograms obtained for the same samples. The displayed data were obtained on the same day and represent at least eight separate experiments.